A predictive model for habitats
Freiburg, Sep 27, 2017
What do marine mammals eat - and how much of it? That was the question Dr Kristin Kaschner sought to answer in her doctoral thesis. “The biggest challenge was that back then, little was known about the distribution of the animals,” says Kaschner, who conducts her research at the University of Freiburg’s department of Biometrics and Environmental Systems Analysis. So she developed an ecological niche model to describe which species occur under which environmental conditions, and implemented it in a geographical information system or GIS. That led to AquaMaps – a data base and an online atlas with maps of the global distribution of marine animals - more than 25,000 of them - from mammals, fish, and turtles to algaes, mollusks, and corals.
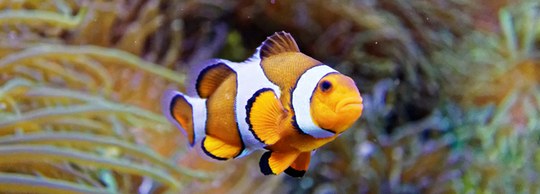
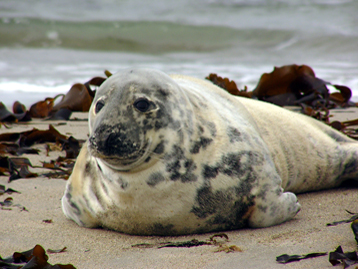
Foto: Thesupermat/Wikimedia Commons, CC BY-SA 4.0
Online atlas for all interested parties
The idea is to make an online atlas available to anyone who is interested,” Kaschner says. In the GIS, the world is divided into a grid of fields each 0.5 degrees longitude by 0.5 degrees latitude. For each field containing an area of sea, there is information on four environmental parameters: Water depth and long-term average water temperature, salinity, ice concentration, and primary production - i.e., algaes and plankton. It is also recorded for each species which conditions it can live under - expressed mathematically as functions describing the optimal and tolerable habitat characteristics. This information is drawn from open access data bases such as Fishbase, SeaLifeBase and Global Biodiversity Information Facility.
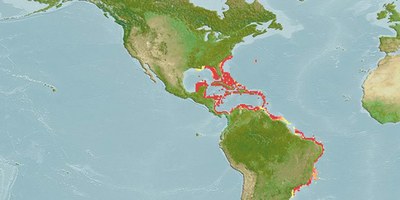
If there is enough sighting data of a species, it is possible to calculate where the appropriate habitats for that species occur - so we are looking at a predictive model here. “We provide access to all our assumptions, it is all transparent and discussable,” Kaschner stresses. “For instance, if someone reports to us that a species is found in warmer water than assumed in AquaMaps, we are able to simply adjust the value.” The maps are intended as a basis for discussion for experts and the maps are regularly recalculated automatically, based on the latest data and sightings. AquaMaps also enables more finely-tuned information on how good a habitat is for a particular species; this is correspondingly shaded in different colors: Potential habitats, in which the relevant animals are rarely found, are marked yellow; core habitats, in which you would certainly expect to find the species, are red - and the darker it is, the more appropriate the area is to that particular species.
In-depth cooperation
AquaMaps is considered one of the two authoritative databases on the global distribution of marine species. The other is a project by the International Union for the Conservation of Nature (IUCN); it does not work with models but compiles maps by assessing experts’ knowledge about each species. The IUCN maps do are not color coded, and Kaschner says it is not clear whether they show potential or core habitats. Equally, the sources and underlying assumptions upon which the maps are based are often not transparent. By contrast, less than ten percent of the AquaMaps have been reviewed by experts. A study published in May 2017 shows that the maps created using both databases nevertheless showed a high degree of agreement for many species - although they are far apart on some. “We would like to provide impetus for intensifying cooperation between the experts for certain species and the experts for computer modeling to improve the methodology,” Kaschner adds. “The goal is to give all actors from the fields of research, politics, and civil society the best possible basis from which to make decisions in matters concerning the protection of endangered species and biodiversity in the oceans.”
Looking to the past and the future
Kaschner has been the driving force behind AquaMaps since 2004. “For a handful of people it has become a hobby,” she says. “Unfortunately there are no funding options in our research system for the permanent maintenance of this kind of database - even though the information it contains is being used world-wide. The latest example is an August 2017 study, which shows many species and which proportion of their distribution area are covered by existing marine nature reserves. AquaMaps also aims to provide insights into the past and the future – the data may be used to investigate how habitats have changed, for instance, since the end of the last Ice Age 10,000 years ago and how climate change is likely to affect animals’ habitats in the next 100 years.
Nicolas Scherger
Quiz: Which species lives in which area?
|
1 Gray seal (Halichoerus grypus) |
A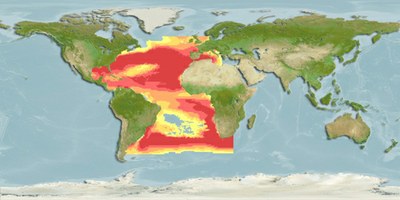 |
|
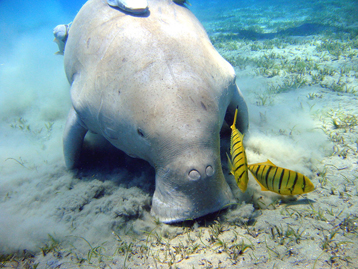
2 Sea cow (Dugong dugon) |
B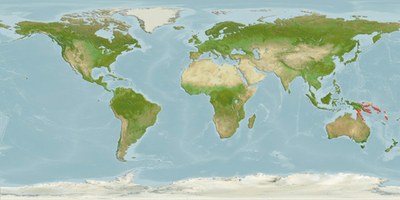 |
|
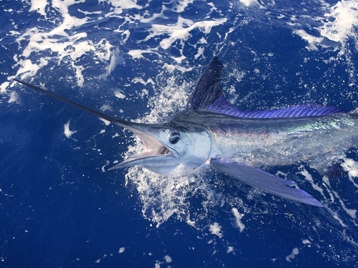
3 White marlin (Kajikia albida) |
C |
|
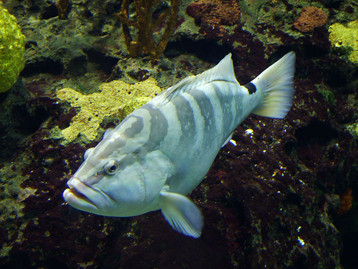
4 Nassau grouper (Epinephelus striatus) |
D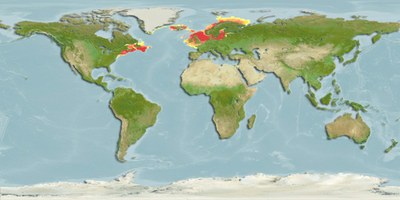 |
|
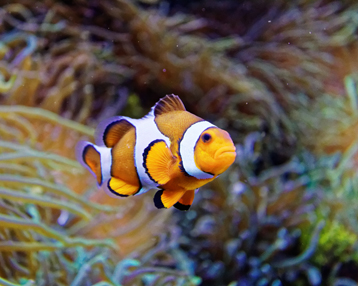
5 Orange clownfish (Amphiprion percula) |
E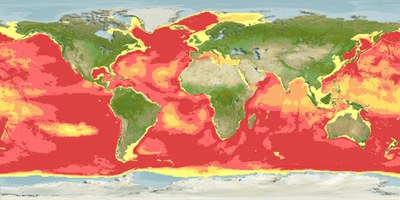 |
|
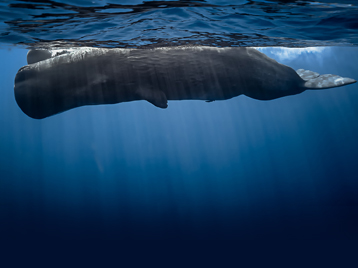
6 Sperm whale (Physeter macrocephalus) |
F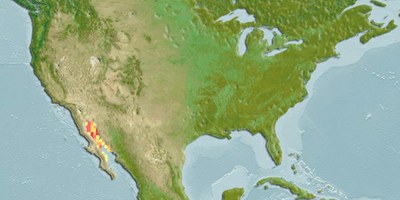 |
|
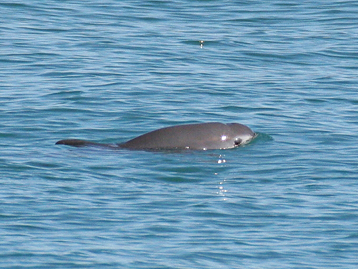
7 Vaquita porpoise (Phocoena sinus) |
G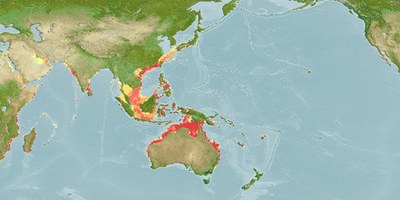 |
Photos: Andreas Trepte/Wikimedia Commons, CC BY-SA 2.5; Julien Willem/Wikimedia Commons, CC BY-SA 3.0; lunamaria/Canstockphoto; Rick Smit/Wikimedia Commons, CC BY 2.0; Thesupermat/Wikimedia Commons, CC BY-SA 4.0; seb2583/Canstockphoto; Paola Olson/NOAA
Source maps: AquaMaps
(Answers: 1D, 2G, 3A, 4C, 5B, 6E, 7F)